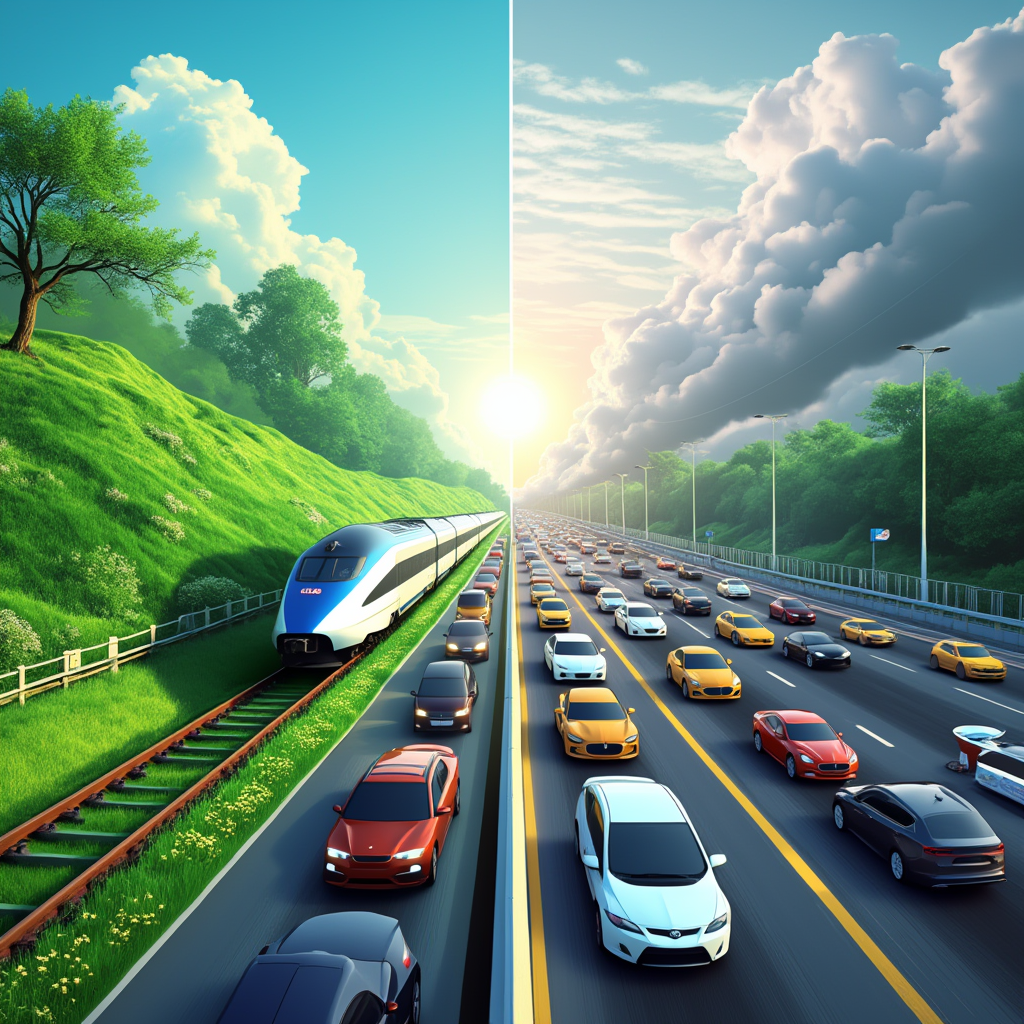
Transport drives a quarter of global carbon emissions. Road vehicles account for 70% of transport-related carbon output, while rail contributes just 1% [11]. The numbers tell a clear story: switching from car to train for medium distances cuts emissions by 80% [10].
Yet the reality proves more complex than these headlines suggest. Electric cars on European grids emit around 47g CO₂e per kilometer [11]. Train emissions range from 6g CO₂e per passenger kilometer on efficient services like Eurostar [11] to 88g per mile on standard routes [10]. Context matters: four passengers in one car changes everything, just as first-class train travel doubles your carbon footprint compared to standard seating [6].
Energy source makes the difference. Nuclear-powered trains in France emit 22g CO₂e per mile. UK intercity trains on fossil-heavy grids produce 80g [6]. Despite these variables, rail remains the cleanest motorized option after walking or cycling. When every emission decision counts, understanding these precise differences matters for your choices.
Carbon Emissions per Passenger Kilometer
Les chiffres par passager-kilomètre révèlent l’impact réel de chaque mode de transport. Technology, fuel source, passenger count : ces trois facteurs changent tout dans vos calculs d’émissions.
Train Emissions: 6g to 88g CO2e per km, depending on type
Eurostar leads with just 6g CO2e per passenger kilometer — the cleanest motorized option you’ll find. Standard national rail hits 41g CO2e [11], while local services reach 58g [7]. The power source makes the difference we mentioned earlier: French nuclear trains emit 22g CO2e per mile [6], while UK intercity trains produce 80g [6].
Car Emissions: 192g for petrol vs 13g for shared EV
Petrol cars start at 192g CO2e per passenger kilometer [11]. Diesel drops to 171g [11]. Electric vehicles cut that to 53g [11] — a 73% reduction that changes your transport footprint immediately [4].
But here’s where occupancy rewrites the rules.
How occupancy changes the equation
Four passengers in a petrol car: emissions drop to 48g CO2e per passenger kilometer [15]. Competitive with many train services. Four passengers in an electric vehicle: just 13.25g CO2e [15]. Lower than everything except Eurostar-level efficiency.
First-class train travel doubles your carbon footprint compared to standard seating [6]. Fewer seats, same energy consumption. High occupancy vehicle lanes reduce emissions by 10-70% compared to regular traffic [12] — proof that passenger count transforms the entire emissions equation.
Vehicle and Energy Source Impact
Power source changes everything. Electric cars start with higher manufacturing emissions — 60% more than conventional vehicles [6]. Yet this carbon debt disappears within two years of driving [6].
Over their lifecycle, EVs cut greenhouse gas emissions by 63% compared to diesel vehicles [7]. Fossil fuel cars produce around 27 tons of CO2 over 100,000 kilometers [6]. The gap widens with cleaner grids.
Train Power Source: Diesel vs Electric vs Hydrogen
Electric trains slash energy consumption by 56% compared to diesel counterparts [8]. Diesel trains emit 19% more CO2 per functional energy unit [9]. The difference compounds across thousands of daily journeys.
Germany launched commercial hydrogen trains in 2018 [10]. They need hydrogen at $12.00/kg to compete with diesel [10]. Although it’s early technology, the potential exists.
Regional Grids Shape Transport Emissions
France’s nuclear grid delivers trains at 22g CO2e per mile. UK’s fossil-heavy mix pushes intercity trains to 80g. Even coal-dominated grids make EVs cleaner than gasoline vehicles [6].
Solar-powered electric cars achieve the smallest footprints per kilometer [11]. Fully renewable electricity can cut transport emissions by 84% [7]. Grid decarbonization multiplies the benefits of electric transport.
The math is simple: cleaner electricity makes cleaner transport.
Lifecycle and Infrastructure Emissions
Manufacturing tells a different story from operational emissions. Electric vehicles start with 60% higher production emissions than conventional cars [13], mostly from battery manufacturing that adds 7,000 kg CO2eq per vehicle [12]. High-speed rail cuts through this disadvantage: lifecycle carbon intensity reaches only 24-32% of private vehicles [14].
The carbon debt gets repaid quickly. EVs offset their manufacturing penalty within 2 years or 21,700 km of driving [15]. Meanwhile, shortened vehicle replacement cycles actually increase total emissions [18] — exactly the opposite of what you’d expect.
Rail infrastructure demands substantial upfront carbon investment. Railway construction generates 58-156 tons of CO2 per kilometer of line annually [16]. Road infrastructure follows similar patterns: material production accounts for 60-90% of total infrastructure emissions [16], with tunnels and bridges representing the most carbon-intensive components for both modes [2].
Yet longevity changes everything. Trains operate for 30-40 years compared to 12 years for cars [15][17]. One complete train lifecycle offsets significantly more carbon through modal shift than its construction emits [2]. This durability advantage compounds over decades — while cars cycle through multiple replacements, trains continue to reduce transport emissions.
Embodied emissions range from 8-51 tons CO2e per vehicle, depending on type [15]. Infrastructure emissions often get overlooked in transport calculations [2], but they alter comparative analyses substantially. Even with infrastructure emissions included, it confirms that rail maintains considerable environmental advantages over car travel [2].
Technology and Policy Trends
Governments move fast when climate targets matter. Both rail and automotive sectors face zero-emission deadlines that will reshape transport within this decade.
EV Adoption and Policy Deadlines (e.g., UK 2030 ban)
The UK bans new petrol and diesel sales by 2030 [19]. More than 20 countries announced similar phase-outs over the next 10-30 years [20]. Global EV sales reached 10 million in 2022 [21], but policy support is constantly shifting: new tariffs on Chinese EVs and changing incentives could reduce US EV adoption from 60% to below 30% by 2035 [22].
Policy creates winners and losers faster than technology alone.
Rail Electrification and Innovation (e.g., hydrogen trains)
Rail focuses on propulsion alternatives. Germany launched commercial hydrogen trains in 2018 [3]. California debuted its first hydrogen passenger service [3]. The UK plans to phase out diesel trains by 2040 [3], betting on both electrification and hydrogen. Catenary electrification proves cost-effective for specific operations [23]. Three propulsion types compete: diesel-hybrid, battery-powered, and hydrogen trains [24].
Which sector is innovating faster?
Cars win on speed. Twelve-year replacement cycles [25] mean faster fleet changes than rail’s 30-40 year cycles [24]. Road innovation comes from private companies responding to regulation [26]. Rail needs public institutions [26]. Even so, rail showed the highest patent activity in 2008-2010 despite fewer total patents [27].
Are trains better for the environment than cars in the future?
Rail keeps its advantage. UK data shows trains produce half the carbon of battery EVs on busy routes [5]. Some experts think cars might compete in countries with clean electricity [25]. Start measuring your real impact with GreenPro—automate your carbon footprint calculation across energy use, travel, and more for a comprehensive emissions view.
Future performance depends on grid decarbonization, occupancy rates, and lifecycle impacts — not just the vehicle you choose.
Key data: train vs car
Here are the key data to compare the carbon impact of each mode of transport.
| Comparison factor | Trains | Cars |
| Carbon emissions (per passenger km) | ||
| Standard service | 41g CO₂e | 192g CO₂e (gasoline) |
| Most efficient option | 6g CO₂e (Eurostar) | 13.25g CO₂e (shared EV with 4 occupants) |
| Local/regular service | 58g CO₂e | 171g CO₂e (diesel) |
| Vehicle lifespan | 30–40 years | 12 years |
| Manufacturing impact | Not specifically mentioned | 60% higher for EVs vs. conventional vehicles |
| Variations by energy source | ||
| Electric (United Kingdom) | 80g CO₂e per mile | 47g CO₂e per km |
| Electric (France – Nuclear) | 22g CO₂e per mile | Not mentioned |
| Infrastructure emissions | 58–156 tons CO₂ per km of track per year | 60–90% from material production |
| First vs. standard class | Double the carbon footprint for first class | Not applicable |
| Full occupancy impact | Not specifically mentioned | Reduced to 48g CO₂e per passenger km (gasoline with 4 passengers) |
These figures show where each option excels — and where your travel choices matter most.
Conclusion
Context plays a crucial role in deciding between taking a train and a car. Occupancy transforms the equation: a shared electric vehicle with four passengers rivals even efficient rail services at 13.25g CO₂e per kilometer. Yet trains consistently outperform single-occupant vehicles, cutting emissions by 80% on medium-distance routes.
Power source matters more than vehicle type. Nuclear grids enable 22g CO₂e per mile for trains, while fossil-heavy grids push the same service to 80g. Electric vehicles follow the same pattern: renewable energy delivers 84% emission reductions compared to fossil fuel charging.
Lifecycle factors favor rail substantially. Trains operate for 30-40 years, compared to 12 years for cars, which offsets higher infrastructure costs through extended service. Electric vehicles repay their manufacturing “carbon debt” within two years, but frequent replacement cycles limit their lifetime advantage.
Government policies worldwide target internal combustion phase-outs by 2030-2040. Rail systems pursue electrification and hydrogen alternatives. Despite rapid automotive innovation, trains maintain their environmental lead: less than half the carbon of battery vehicles on busy routes.
Start measuring your real impact. With GreenPro, automate your carbon footprint calculation and gain a clear, comprehensive view of your emissions — from energy use and team travel to digital storage and content distribution.
The cleanest choice depends on your specific situation. Trains remain the most sensible motorized option after walking and cycling. Yet shared electric vehicles on clean grids can compete under certain conditions. Future performance will depend less on transport mode and more on occupancy rates, energy sources, and lifecycle management.
Key Takeaways
Understanding the actual environmental impact of trains versus cars requires looking beyond simple emissions to consider occupancy, energy sources, and lifecycle factors that dramatically affect carbon footprints.
• Trains cut emissions by 80% for medium-distance travel, with the most efficient services like Eurostar producing just 6g CO₂e per passenger kilometer compared to 192g for petrol cars.
• Passenger occupancy transforms the equation entirely – a shared electric vehicle with four occupants emits only 13.25g CO₂e per km, rivaling even efficient train services.
• Energy source matters more than vehicle type – trains on nuclear grids emit 22g CO₂e per mile versus 80g on fossil fuel grids, while EVs on renewable energy achieve 84% emission reductions.
• Lifecycle advantages favor trains significantly – rail vehicles last 30-40 years versus 12 years for cars, offsetting higher infrastructure emissions through extended service life.
• Both sectors are rapidly decarbonizing through government policies phasing out fossil fuels by 2030-2040, but trains maintain environmental leadership even as electric vehicles improve.
The key insight: while trains generally offer superior environmental performance, the gap narrows with high-occupancy electric vehicles and clean energy grids, making context crucial for optimal transportation choices.
FAQs
Q1. How do carbon emissions compare between trains and cars? Trains generally produce about 80% fewer emissions than cars for medium-distance trips. However, the exact comparison depends on factors like occupancy and energy source. A fully occupied electric car can rival train efficiency under certain conditions.
Q2. Which mode of transport is the most environmentally friendly? Walking and cycling are the most environmentally friendly modes of transport. Among motorized options, trains are generally the most eco-friendly, followed by shared electric vehicles, then conventional cars.
Q3. How does passenger occupancy affect the environmental impact of cars and trains? Occupancy significantly changes emissions calculations. A petrol car with four passengers reduces emissions to 48g CO2e per passenger-kilometer. In contrast, an electric car with four occupants produces only 13.25g CO2e per passenger-kilometer, making it competitive with some train services.
Q4. What role does the energy source play in the environmental impact of trains and cars? The energy source dramatically affects emissions. For example, trains running on nuclear power in France emit just 22g CO2e per mile, while UK intercity trains produce around 80g. Similarly, electric vehicles charged from renewable sources have a much lower carbon footprint than those charged from fossil fuel-based grids.
Q5. How do lifecycle considerations affect the environmental comparison between trains and cars? Lifecycle analysis reveals significant differences. While electric vehicles have higher manufacturing emissions, they typically offset this within two years of use. Trains benefit from much longer lifespans (30-40 years compared to 12 years for cars), which reduces their lifetime environmental impact per kilometer traveled.