
For most companies, scope 3 emissions account for 70 to 95 percent of their total greenhouse gas footprint [3], yet many carbon inventories still stop at the factory gate. Understanding scope 1, 2 and 3 emissions is the starting point of any credible climate strategy, because the three categories together describe where a company’s impact actually sits. Defined by the Greenhouse Gas Protocol, the framework separates the emissions a business controls directly from those it only influences through its energy supplier and its value chain [1]. This guide explains what each scope covers, how they are measured, what regulation now requires, and how the categories apply to the media and events sector.
Open the calculator ↓
What scope 1, 2 and 3 emissions mean
The concept of scope 1, 2 and 3 emissions comes from the Greenhouse Gas Protocol, the accounting framework developed by the World Resources Institute and the World Business Council for Sustainable Development that has become the global reference for corporate carbon reporting . The system groups emissions of the seven greenhouse gases recognised under the Kyoto Protocol into three categories, sorted by how directly a company controls the source [1].
The logic behind this split is twofold: it helps organisations distinguish direct from indirect emission sources, and it prevents two companies from counting the same tonne of CO2 in the same scope. That second principle matters for supply chains, where one company’s scope 1 becomes another’s scope 3. A clear reading of the GHG Protocol methodology is therefore the foundation for comparable, non-duplicated reporting.
Scope 1: direct emissions
Scope 1 covers direct emissions from sources a company owns or controls [2]. Typical sources include fuel burned in company boilers and furnaces, emissions from on-site industrial processes, and the fuel used by a company-owned or leased vehicle fleet. Fugitive emissions, such as refrigerant leaks from air-conditioning systems, also fall under this scope.
Because these sources sit inside the company’s own operations, scope 1 is usually the most straightforward to measure: the data comes from fuel invoices, meter readings and fleet records. For an office-based or service business, scope 1 is often small. For a manufacturer, a logistics operator or an energy producer, it can dominate the inventory. Reducing scope 1 typically means electrifying vehicles and heating, improving process efficiency, or switching to lower-carbon fuels.
Scope 2: purchased energy
Scope 2 covers indirect emissions from the generation of energy a company buys and consumes: electricity, steam, heat and cooling [2]. The emissions physically occur at the power plant, but they are attributed to the company that consumes the energy, because its demand is what drives the generation.
The GHG Protocol requires two calculation methods for scope 2. The location-based method uses the average emission factor of the local grid, reflecting the physical electricity mix. The market-based method reflects the specific contracts a company signs, such as renewable energy purchase agreements or guarantees of origin. Reporting both figures gives a fair picture: the location-based number shows exposure to the grid, while the market-based number shows the effect of procurement choices. Sourcing certified renewable electricity is the most direct lever for cutting scope 2.
Scope 3: the value chain and its 15 categories
Scope 3 covers all other indirect emissions across a company’s value chain, both upstream and downstream [4]. It is almost always the largest and hardest scope to quantify, because it depends on data held by suppliers, distributors and customers. The GHG Protocol Corporate Value Chain Standard divides scope 3 into 15 categories, split between eight upstream and seven downstream.
| Group | Category |
|---|---|
| Upstream | 1. Purchased goods and services |
| Upstream | 2. Capital goods |
| Upstream | 3. Fuel and energy-related activities |
| Upstream | 4. Upstream transportation and distribution |
| Upstream | 5. Waste generated in operations |
| Upstream | 6. Business travel |
| Upstream | 7. Employee commuting |
| Upstream | 8. Upstream leased assets |
| Downstream | 9. Downstream transportation and distribution |
| Downstream | 10. Processing of sold products |
| Downstream | 11. Use of sold products |
| Downstream | 12. End-of-life treatment of sold products |
| Downstream | 13. Downstream leased assets |
| Downstream | 14. Franchises |
| Downstream | 15. Investments |
Not every category is material for every organisation. A software company will have negligible emissions from the processing of sold products, while a car manufacturer will see enormous emissions from the use of sold products [4]. Categories such as business travel and employee commuting tend to be minor for high-impact sectors, often a fraction of a percent of the scope 3 total [3]. The first step in any scope 3 exercise is a materiality screen that identifies where the emissions concentrate, so effort goes where it matters. For fast-moving consumer goods companies, scope 3 can reach 80 to 95 percent of the total footprint [3].
How businesses measure and report each scope
Measuring emissions follows a consistent logic across the three scopes: multiply activity data (litres of fuel, kilowatt-hours of electricity, kilograms of purchased material) by an emission factor drawn from a recognised database. Scope 1 and scope 2 rely mostly on primary data from meters and invoices. Scope 3 often starts with spend-based estimates and moves towards supplier-specific data as the inventory matures.
Reporting is no longer purely voluntary in Europe. Under the Corporate Sustainability Reporting Directive and its European Sustainability Reporting Standards, in-scope companies must disclose gross scope 1, 2 and 3 emissions, with scope 3 mandatory wherever value chain emissions are material [5]. The standard on climate change, ESRS E1, requires emissions to be reported separately from any carbon credits or removals, with no netting allowed. Companies generally fall in scope when they meet the size thresholds for large undertakings, and certain non-EU parent companies with substantial European operations are also captured [6]. A structured approach to carbon accounting makes the difference between a defensible disclosure and an audit risk. Some frameworks now also discuss avoided emissions, sometimes called scope 4, although these sit outside the mandatory three scopes.
Scope 1, 2 and 3 emissions in media and events
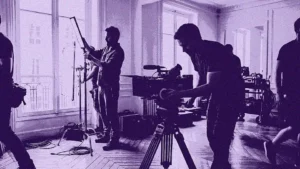
The scope framework applies to film, television and live events just as it does to any other industry, but the balance between the three scopes is distinctive. In an audiovisual production, direct scope 1 emissions come from generators on location and from the production’s own vehicles, while scope 2 covers the electricity drawn by studios, offices and post-production facilities. As with most service-driven activities, the bulk of the footprint lands in scope 3 .
For a shoot, that scope 3 tail includes crew and cast travel, hotel nights, catering, set construction, costumes, freight of equipment and hired services across the supply chain. A study of feature films and television series found average emissions of around 280 tonnes of CO2 equivalent per production, with transport and energy among the heaviest contributors [9]. Live events show a similar pattern, where audience travel, temporary power and on-site catering drive the total.
Sector-specific tools exist to structure this measurement. The Albert calculator, developed within the British screen industry, is built in alignment with the GHG Protocol and spans scope 1, 2 and 3 for a production [7]. In France, the Ecoprod collective provides methodology and resources adapted to the audiovisual sector [8]. The recurring difficulty is not the framework but the data collection: gathering fuel, travel and supplier figures across dozens of vendors on a tight schedule.
This is where GreenPro, TheGreenshot’s carbon tracking tool, fits in. GreenPro automates data collection for productions and events, producing footprints aligned with Albert, the CSRD and the GHG Protocol without manual spreadsheet entry. Learn more about GreenPro.
Estimate your company’s carbon footprint
Turning these principles into a concrete figure is the quickest way to see where a company’s emissions sit. The free TheGreenshot calculator below estimates a company’s annual footprint across scopes 1, 2 and 3, using official ADEME and EPA emission factors.
Conclusion
Scope 1, 2 and 3 emissions give businesses a common language for their carbon footprint: direct emissions they control, indirect emissions from the energy they buy, and the wide value chain that usually holds most of the impact. Measuring all three, rather than the convenient ones, is what separates a genuine climate strategy from a partial one, and regulation such as the CSRD now makes that completeness a legal expectation for large companies. As emission factors improve and supplier data becomes more accessible, the effort will shift from estimating scope 3 to actively reducing it. Companies that build reliable scope 1, 2 and 3 accounting today will be the ones ready to prove progress tomorrow.
FAQ
What is the difference between scope 1, 2 and 3 emissions?
Why are scope 3 emissions so hard to measure?
Are companies legally required to report scope 1, 2 and 3 emissions?
What is the difference between location-based and market-based scope 2?
How do film shoots and events fit the scope framework?
Going further with TheGreenshot
Turning a clear understanding of scope 1, 2 and 3 emissions into an audit-ready inventory is where most teams lose time, especially on the scope 3 categories that depend on dozens of suppliers. GreenPro, the carbon tracking tool from TheGreenshot, was built to close that gap for productions and live events. It automates data collection through invoice scanning and OCR, structures activity data against recognised emission factors, and generates footprints aligned with the Albert standard, the CSRD and the GHG Protocol. Real-time dashboards and AI-driven insights show where emissions concentrate across the three scopes, so effort goes to the categories that matter. Teams that want to see how automated carbon accounting works in practice can explore a tailored walkthrough of the platform.
Our carbon experts help production studios frame strategy, train teams and track results, tailored to operational constraints.